Search This Blog

Friday, April 30, 2021

Established Covered Calls in KB Home

Today a new Covered Calls position was established in KB Home (ticker KBH) with a May 21st options expiration date.  A buy/write transaction was made with 300 shares purchased at $48.49 and three Calls sold at the $46.00 strike price for $3.11 per share. Given the Covered Calls Advisor's current cautious outlook, a moderately in-the-money Covered Calls position was established.  The Delta was 72.4 and this approximates a probability of 72.4% that the Call options will be in-the-money and therefore the stock assigned on the options expiration date. Two potential results for this Covered Calls position, as detailed below, includes the possibility of early exercise since the May 5th, 2021 ex-dividend is prior to the May 21st, 2021 options expiration date.

KB Home is a home builder with high exposure to entry-level built-to-order homes, a good niche in the current market environment.  In this regard, there are three primary circumstances that provide the most conducive environment for homebuilders' success: demographics, low interest rates, and current Monthly Supply of Houses in the U.S.(Source: Federal Reserve Bank of St. Louis). All three of these factors are currently very positive for homebuilders.  Also, the NAHB Housing Market Index surveys homebuilders monthly on their current (and their estimates about the next 6 months) sentiment (from 0 to 100).  This month's index is 83 which is near its all-time high (since 1985) of 90 (Note: The lowest rating of 8 was in January 2009).  So we are definitely now in a strong "sellers' market".  The Covered Calls Advisor will continue to track these factors and will likely remain invested in monthly Covered Calls in companies in this industry as long as all three of these conditions remain positive.

Despite the pandemic, the most recent fiscal year's (2020) earnings exceeded 2019, and 2021 revenues are estimated to increase by 40% above 2020; and earnings by even more, to approximately $5.80 per share (a forward P/E ratio of only 8.4).   

The 33.2 Implied Volatility for these KB Home Call options was attractive to the Covered Calls Advisor since it is substantially higher than the current S&P 500 Volatility Index (VIX) of 18.5.  Finally, the average price target of 15 analysts covering the company is $53.09 (+9.5% above its current price).  

As detailed below, two potential return-on-investment results are: 

  •  +1.4% absolute return (equivalent to +99.7% annualized return for the next 5 days) if the stock is assigned early (business day prior to the May 5th ex-dividend date); OR 
  • +1.7% absolute return (equivalent to +28.1% annualized return over the next 22 days) if the stock is assigned on the May 21st options expiration date.


KB Home (KBH) -- New Covered Calls Position
The Buy/Write transaction today was as follows:
04/30/2021 Bought 300 KB Home shares @ $48.49
04/30/2021 Sold 3 KB Home 05/21/2021 $46.00 Call options @ $3.11
Note: the Time Value (aka Extrinsic Value) in the Call options was $.62 per share = [$3.11 Call options premium - ($48.49 stock price - $46.00 strike price)]
05/05/2021 Upcoming quarterly ex-dividend of $.15 per share

Two possible overall performance results (including commissions) for this KB Home Covered Calls position are as follows:
Covered Calls Cost Basis: $13,616.01
= ($48.49 - $3.11) * 300 shares + $2.01 commission

Net Profit Components:
(a) Options Income: +$933.00
= ($3.11 * 300 shares)
(b) Dividend Income (If option exercised early on May 4th, the business day prior to the May 5th ex-div date): +$0.00; or
(b) Dividend Income (If KB Home stock assigned at May 21st, 2021 expiration): +$45.00
= ($.15 dividend per share x 300 shares)
(c) Capital Appreciation (If KB Home Call options assigned early on May 4th): -$747.00
+($46.00 - $48.49) * 300 shares; or
(c) Capital Appreciation (If shares assigned at $46.00 strike price at options expiration): -$747.00
+($46.00 - $48.49) * 300 shares

1. Total Net Profit [If option exercised on May 4th (business day prior to May 5th ex-dividend date)]: +$186.00
= (+$933.00 options income +$0.00 dividend income -$747.00 capital appreciation); or
2. Total Net Profit (If KB Home shares assigned at $46.00 strike price at May 21st, 2021 expiration): +$231.00
= (+$933.00 +$45.00 -$747.00)

1. Absolute Return (If option exercised early on Feb. 2nd): +1.4%
= +$186.00/$13,616.01
Annualized Return (If option exercised early): +99.7%
= (+$186.00/$13,616.01)*(365/5 days); or
2. Absolute Return (If KB Home shares assigned at $46.00 at May 21st, 2021 options expiration): +1.7%
= +$231.00/$13,616.01
Annualized Return (If KB Home shares assigned at $38.00 at Feb 19th, 2021 expiration): +28.1%
= (+$231.00/$13,616.01) * (365/22 days)

Early assignment is unlikely, but assignment on the expiration date would also provide a good return-on-investment result for this KB Home investment.  These returns will be achieved as long as the stock is above the $46.00 strike price at assignment.  If the stock declines below the strike price, the breakeven price of $45.23 ($48.49 -$3.11 -$.15) provides 6.7% downside protection below today's stock purchase price.

At least eight of the nine metrics used in the Covered Calls Advisor's Dividend Capture Strategy spreadsheet must be 'YES' prior to establishing a position.  As shown below with this KB Home position, eight criteria were achieved.


Tuesday, April 27, 2021

Covered Calls Established in Hologic Inc.

This afternoon an initial Covered Calls position was established in Hologic Inc. (ticker symbol HOLX) when the Covered Calls Advisor's buy/write limit order was executed.  Two hundred shares were purchased at $72.92 and two May 21st, 2021 Call options were sold at $4.48 at the $70.00 strike price.  The time value when this Covered Calls position was established was $1.56 per share = [$4.48 Call options price - ($72.92 stock price - $70.00 strike price)], so the downside breakeven price is $68.44 ($70.00 strike price - $1.56 time value).  Given the Covered Calls Advisor's current cautious outlook, a moderately in-the-money Covered Calls position was established with the Delta at 67.7, which approximates a probability of 67.7% that the Call options will be in-the-money on the options expiration date.

The Covered Calls Advisor prefers not to hold positions when there is an upcoming earnings report prior to any company's options expiration date but an exception was made in this case since Hologic issues their Q1 2021 earnings report after market close tomorrow. The earnings per share expected by analysts is $2.62, but the expected range is narrow between $2.57 and $2.68 and I believe Hologic will continue its trend of the past 5 quarters of exceeding estimates.  Also earlier this month, they announced their fourth acquisition so far this year, a $975 million acquisition (90% of which is paid with cash) of a company that expands Hologic's vertical capabilities in their medical diagnostics business.  I believe their decision to make this purchase is also an indicator that their current strong business trends are continuing.  

About a month ago, I shared an article on this blog of the Covered Calls Advisor's method of using an Options and Company Checklist to obtain important information on potential companies for Covered Calls investments. In this post I used the Checklist for Hologic (see post here).  The quality, value, and growth characteristics of Hologic highlighted by the Checklist made it a worthwhile investment candidate for the Covered Calls Advisor.  I am also impressed with the management and vision of CEO Steve MacMillan -- see his interview from February 2021 with Jim Cramer on CNBC's Mad Money here.  

As detailed below, a potential return-on-investment result for this Hologic Inc. position is +2.3% absolute return (equivalent to +33.1% annualized return over the next 25 days) if the stock is in-the-money and therefore assigned on the May 21st, 2021 options expiration date.


Hologic Inc. (HOLX) -- New Covered Calls Position

The buy/write transaction was as follows:
04/27/2021 Bought 200 shares of Hologic stock @ $72.92 per share 
04/27/2021 Sold 2 Hologic May 21st, 2021 $70.00 Call options @ $4.48 per share
Note: The Implied Volatility of the Call options was 36.1 when this transaction was executed.  

A possible overall performance result (including commissions) would be as follows:
Covered Calls Cost Basis: $13,689.34
= ($72.92 - $4.48) * 200 shares + $1.34 commission

Net Profit Components:
(a) Options Income: +$894.66
= ($4.48 * 200 shares) - $1.34 commission
(b) Dividend Income: +$0.00 
(c) Capital Appreciation (If Hologic stock is above $70.00 strike price at May 21st, 2021 expiration): -$584.00
= ($70.00 -$72.92) * 200 shares

Total Net Profit: +$310.66
= (+$894.66 Call option income +$0.00 dividend income -$584.00 capital appreciation)

Absolute Return-on-Investment: +2.3%
= +$310.66/$13,689.34
Equivalent Annualized Return-on-Investment: +33.1%
= (+$310.66/$13,689.34)*(365/25 days)

Sunday, April 25, 2021

Exploiting Our Covered Calls Investing "Edges"

For any given investing strategy, the investor should try to identify any and all discernible advantages that particular strategy has when compared against a basic Buy-and-Hold stocks approach.  In this regard, consider this investing wisdom from renowned investor Seth Klarman: "We believe that while investors need to focus great attention on the fundamentals, they must simultaneously answer the question: What's your edge? To succeed in today's overcrowded environment, investors need an edge, an advantage over the competition, to help them allocate their scarce time. Since most everyone has access to complete and accurate databases, powerful computers, and well-trained analytical talent, these resources provide less and less of a competitive edge; they are necessary but not sufficient. You cannot have an edge doing what everyone else is doing; to add value you must stand apart from the crowd. And when you do, you benefit from watching the competition at work." 

Identifying and then establishing a disciplined investing process to exploit these "edges" is what enables us to attain additional profit beyond that which would otherwise be obtained through a passive Buy-and-Hold stocks strategy.  So what are our "edges" as Covered Calls investors?  It is this advisor's belief that there are twelve edges, each of which can contribute to our opportunity to achieve excess returns:

1. Specialize in Covered Calls Investing -- Here is the introduction to one of my prior blog posts: "One of the most important investing lessons I've learned is to select an investing strategy that you are most comfortable with and stay with it. That is, do not try to be "a jack-of-all-trades and a master of none." Instead, try to continually increase your knowledge related to the strategy you are using and seek to become an expert at it." This fundamental belief in combination with the performance results achieved is what has sustained my commitment to Covered Calls investing during the past three decades -- thus this Covered Calls Advisor's investing motto of "Stick with Covered Calls."

2. Active Management -- The typical Buy-and-Hold investing strategy is a passive investing approach since stocks, mutual funds, and ETFs are normally purchased and held for a period of years. Likewise, Covered Calls investing can also be deployed passively, and passive Covered Calls-related indices (for example BXM, BXY, and PUT) have been developed. Research has shown that the long-term returns performance of these indices are approximately equivalent to that of a comparable buy-and-hold investment but with approximately 30% less risk. But as individual investors, we have the opportunity to be "active" (contrasted with "passive") managers of our Covered Calls portfolios. As active managers, an associated "edge" comes from deploying the strategies itemized in the additional items enumerated in the remainder of this article.

3. Stock Selection -- Stocks are an appreciating asset over prolonged time periods and historically have achieved a higher return-on-investment than buying other asset classes (bonds, real estate, commodities, stock options, etc.).  So, buying stocks should be the foundation of any long-term investing strategy, and buying stocks is fundamental to the Covered Calls strategy--where we buy stocks and sell Call options against the stocks we own.  Identifying and buying good stocks is Job #1 for the Covered Calls investor. Unlike broad-based indices, such as the S&P 500 ETF (SPY) or other ETFs (such as the sector ETFs), we seek to purchase value-oriented individual equities which are likely to continue in the future, as they have historically, to outperform broad-based indices.

4. Adjust Moneyness of Strike Prices -- As active Covered Calls investors, we have the flexibility to sell out-of-the-money Covered Calls when our outlook is more bullish and in-the-money when bearish, whereas the mechanical indices sell the same moneyness every month (for example, only at-the-money calls in the case of BXM). With even modest success at adjusting moneyness to coincide with (1) our overall market outlook, and (2) our personal risk tolerance, incrementally higher return-on-investment results are achieved.

5. Sell Higher-Than-Average Volatility -- Because of the large cap nature and the diversification inherent in the S&P 500 index, its Volatility Index (VIX) is lower than the overwhelming majority of individual stocks that comprise the index. Selling options on individual equities (with higher Implied Volatility than VIX) provides Covered Calls investors with higher options income (and thus somewhat higher overall portfolio returns) than would be achieved by either (1) buy-and-hold investing directly in the S&P 500; or (2) selling S&P 500 options (such as is done with the BXM, BXY, and PUT indices).  

In addition, we can benefit from the knowledge that the Implied Volatility of a stock has an inverse relationship with its short-term stock price.  That is, Implied Volatility (and therefore also the annualized-return-on-investment (aroi) potential) decreases as a stock's price increases (and becomes overbought).  Conversely, Implied Volatility (and aroi) increases somewhat when short-term stock prices decline and become oversold, often making this an opportune time to establish new Covered Calls positions--but of course only in companies we are bullish on (see item #3 on Stock Selection above). 

6. Exploiting the Volatility Risk Premium -- Academic research has demonstrated that the Implied Volatility of option prices is, on average, higher their subsequent actual realized volatility. Thus, by selling options to establish our Covered Calls positions (NOT buying options), we Covered Calls investors exploit this effect (another "edge" versus buy-and-hold investors) and profit from it.

7. Increase Frequency of Trading -- The time value decay of options increases the closer they get to their expiration date.  So, shorter duration Covered Calls positions provide a higher potential annualized-return-on-investment than their longer duration counterparts.  Favoring monthly, bi-weekly, or even weekly Covered Calls is preferable to positions of longer duration (two months, three months, or longer).  An added benefit of shorter-dated options is that they provide more frequent opportunities to re-evaluate our holdings and to modify our ongoing strike prices given the ever-changing nature of market prices and individual stock outlooks.  

8. Adjust Our Position Sizing -- We can use the Greek value of Delta as a good approximation of the probability of assignment of any Covered Calls position we are considering prior to entering the position.  Delta values enable us also approximate an Expected Value for the Annualized Return-on-Investment potential for various stock price outcomes on the options expiration date (such as if the stock price is unchanged, or if the stock price ends in-the-money).  This knowledge of various Expected Value Return-on-Investment outcomes helps us to determine the position sizing for the investment -- higher Expected Value Returns corresponding to larger-than-average total dollar positions and lower Expected Value Returns corresponding to below-average total dollar positions.

9. Seek to Minimize Losses -- Because our compounded return-on-investment results over time are geometric returns (not average returns), losses are difficult to overcome.  For example, a 33 1/3% loss doesn't require a 33 1/3% gain to get back to breakeven; it requires a 50% gain (and a 50% loss would require a 100% gain).  Covered Calls provide an advantage over the traditional buy-and-hold stocks in this regard since selling Call options against our stock holdings provides a hedge (i.e. lowers our stock downside breakeven price point) and therefore increases the likelihood that we will be profitable on our positions.  Furthermore, when we are selecting a strike price for any position where we have doubt between two potential strikes, we can select the more conservative (i.e. lower) strike price to decrease our probability of losing money on the position, therefore further increasing our probability of achieving a profitable outcome.

10. Invest in Non-Correlated Assets -- Another way (in addition to that stated in #9 above) we can minimize drawdowns (i.e. losses) in our portfolio is to seek to diversify our portfolio via non-correlated assets.  We know intuitively and from our own investing experience that different asset classes rotate in-and-out of favor and that it is extremely difficult to try to predict when these rotations will occur.  But there is substantial academic research that has determined that investing in non-correlated assets (such as by asset classes, sectors, industries, geographies, etc.) enhances geometric returns.  So, achieving adequate diversification via non-correlated assets in our portfolios is another important consideration.  

11. Use a Tax-Advantaged IRA Account -- The great likelihood of triggering short-term capital gains makes Covered Calls an ideal strategy for either Traditional and/or Roth IRAs since these gains can either be taken as current year distributions (taxable) or left in the IRA (tax-free) for additional future investments growth.

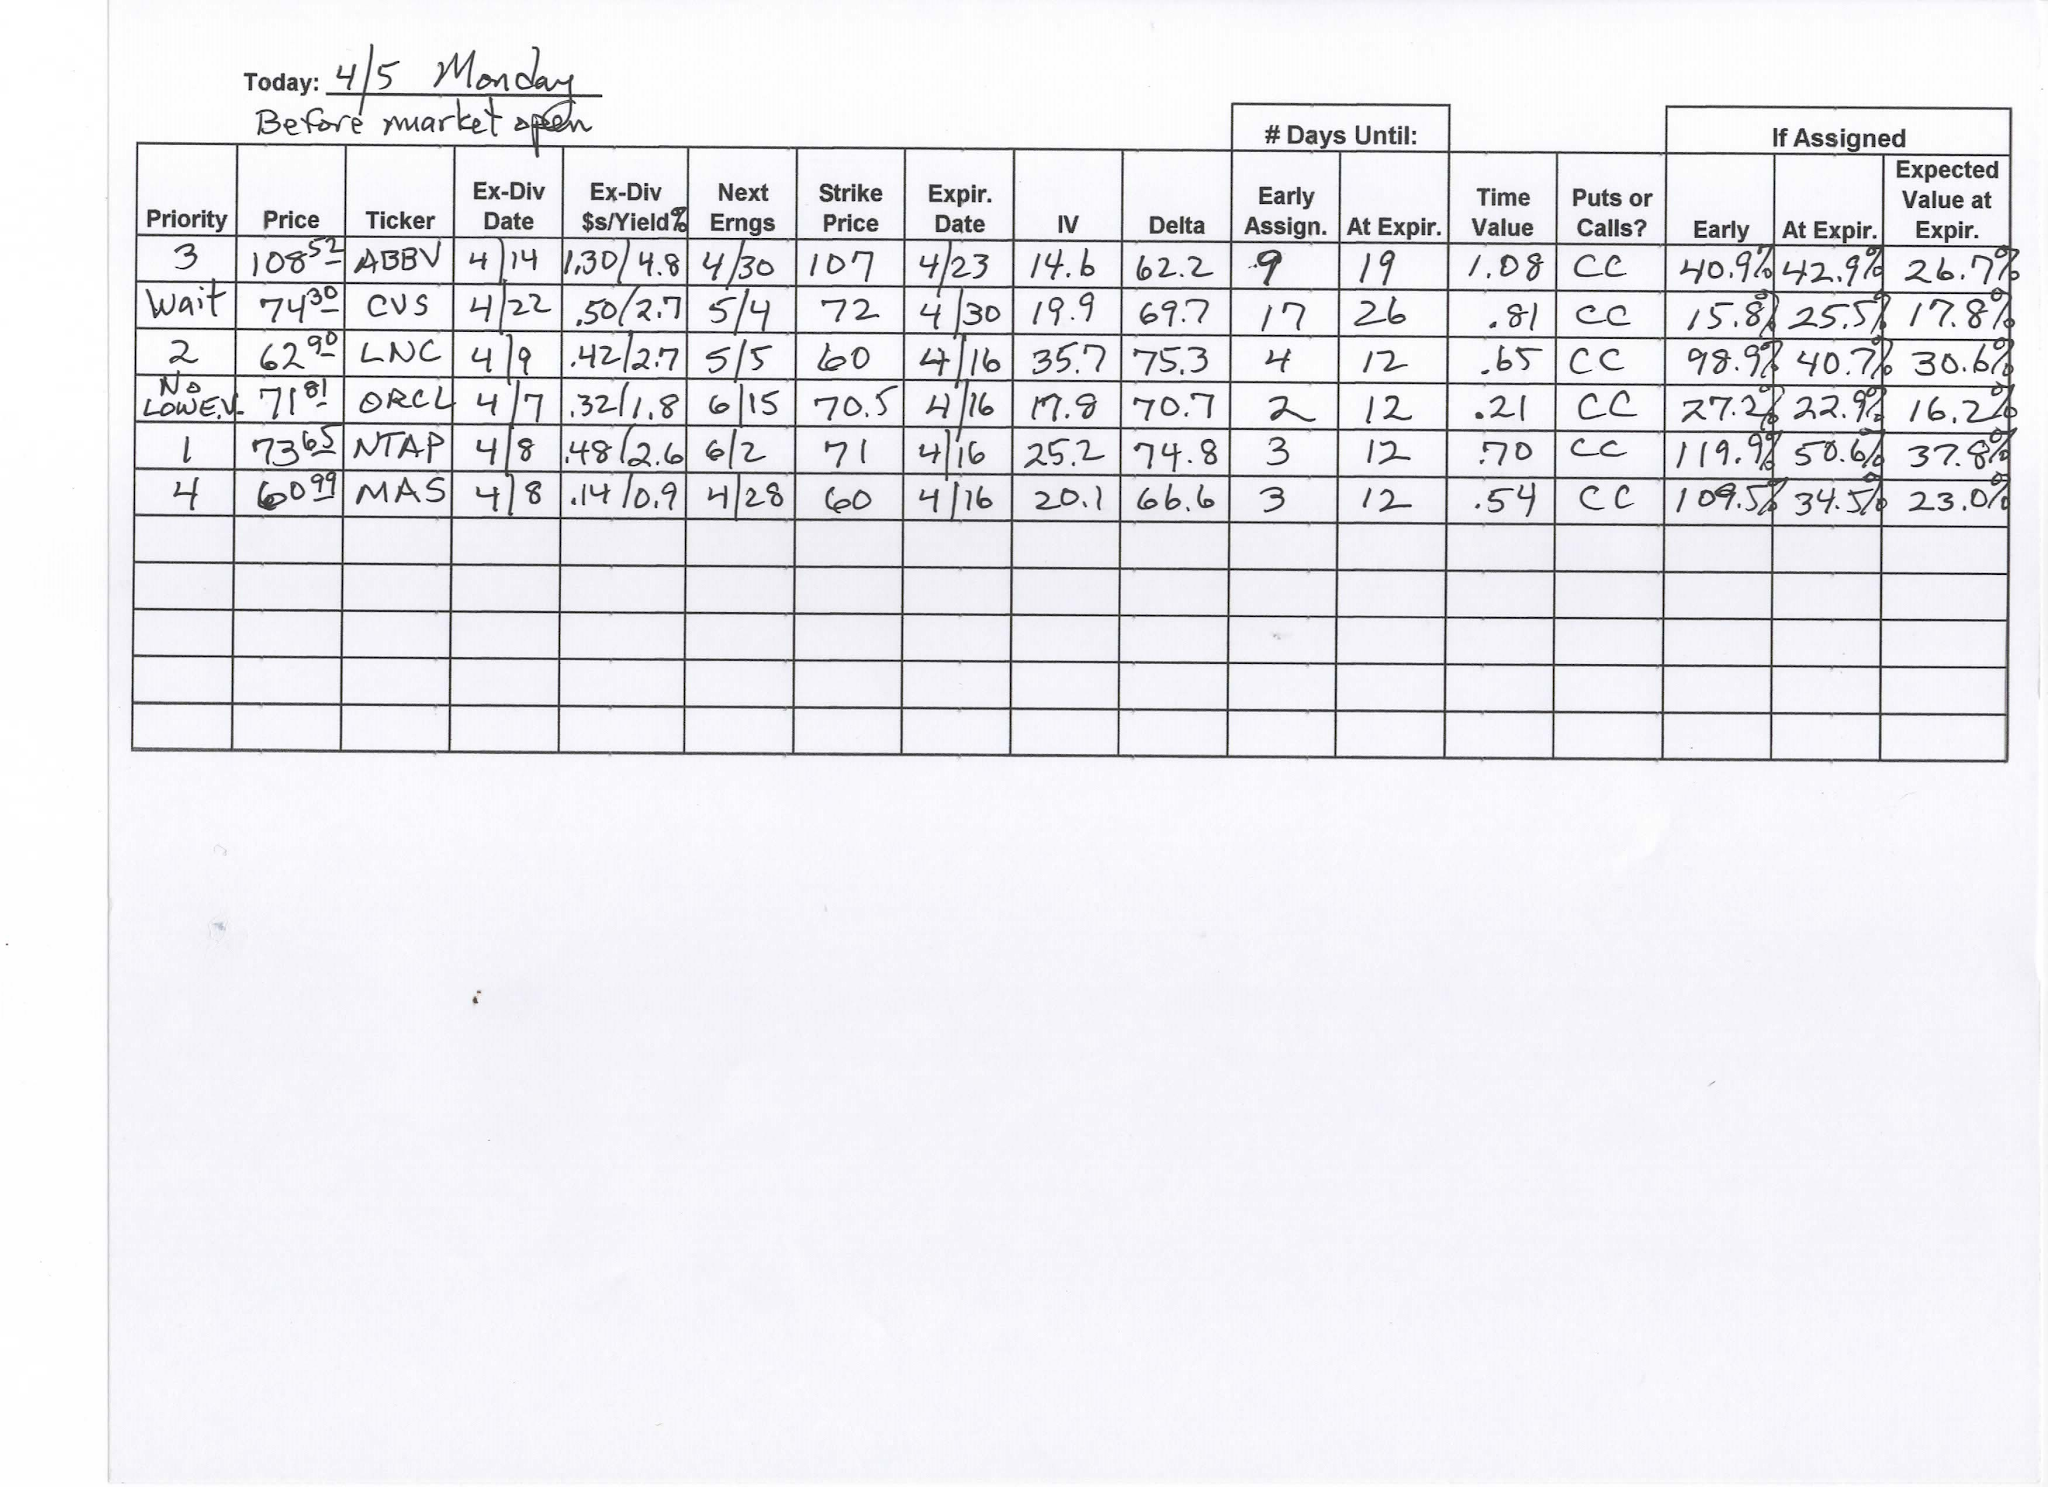
12. Use a Dividend Capture Strategy When Appropriate -- Covered Calls investors can increase the annual dividend yield of quarterly dividend-paying companies by establishing Covered Calls positions during the single month each quarter when they go ex-dividend (and avoiding those same companies during the other two months each quarter when no dividend is paid).  The Covered Calls Advisor's "Dividend Capture Strategy Worksheet" was designed to identify these opportunities that provide another "edge" to our financial results.  These positions can be especially attractive to boost returns in low-growth and/or below average Implied Volatility sectors (like the Consumer Staples, Energy, Financials, Industrials, Materials, Real Estate, and Utilities sectors).       

------------------------------------------------------------------------------------
From my experience, my best estimate is that over a long-term investing horizon (say 10+ years), a disciplined Covered Calls investor that is cognizant of the twelve "edges" described above, and works to take advantage of them might expect (on average over the years), to outperform a buy-and-hold benchmark by at least 3 to 5 percentage points on an annualized-return-on-investment basis. This extra return might not sound especially impressive, but the power of compounding investment returns is substantial. Suppose that over the next decade a Buy-and-Hold S&P 500 investor averages an 8% annualized return; and a Covered Calls investor averages a 12% return. Then, an initial $100,000 portfolio would grow (excluding taxes) over the next 10 years, to about $215,900 for a buy-and-hold portfolio; but to $310,600 for the Covered Calls portfolio. Whereas individually, each of these "edges" described above provides only a small advantage, together they can provide a very significant advantage for informed and disciplined Covered Calls investors.
---------------------------------------------------------------------------------

More detailed information on Covered Calls investing can be found on the author's free blog site, http://coveredcallsadvisor.blogspot.com/


Friday, April 23, 2021

Closed Covered Calls Position in EOG Resources Inc.

Late in this afternoon's trading session, the Covered Calls Advisor decided to close out the Covered Calls position in EOG Resources Inc. (ticker EOG).  The three $69.50 Call options were expiring today (April 23rd, 2021), but with the stock slightly below the $69.50 strike price at $69.25, the Covered Calls Advisor closed the position rather than allowing the Calls to expire and therefore holding the 300 shares of EOG stock until Monday morning's opening. 

As detailed below, the return-on-investment result was +2.4% absolute return in 23 days (equivalent to a +37.5% annualized return-on-investment).


EOG Resources Inc.(EOG) -- Covered Calls Position Closed

The simultaneous buy/write transaction was as follows:
04/01/2021 Bought 300 shares of EOG Resources Inc. stock @ $73.02 per share 
04/01/2021 Sold 3 EOG April 23rd, 2021 $69.50 Call options @ $5.02 per share
Note: The options Implied Volatility was 33.2 when this buy/write transaction executed.
04/15/2021 Ex-dividend of $.4125 per share
04/23/2021 Closed out (i.e. unwound) the JPM Covered Calls position by Selling-to-Close 300 EOG shares @ $69.25 and Buying-to-Close the 3 EOG 4/23/2021 Call options @ $.04 per share. 

The overall performance results (including commissions) was as follows:
Covered Call Cost Basis: $20,402.01
= ($73.02 - $5.02) * 300 shares + $2.01 commission

Net Profit Components:
(a) Options Income: +$1,489.98
= ($5.02 -$.04) * 300 shares - $4.02 commissions
(b) Dividend Income (300 EOG shares went ex-dividend on 4/15/2021 @ $.4125 per share): +$123.75
= $.4125 per share x 300 shares
(c) Capital Appreciation (300 EOG shares sold at $69.25 per share): -$1,131.00
= ($69.25 strike price - $73.02 stock purchase price) * 300 shares

Net Profit (EOG Covered Calls closed out by Selling-to-Close 300 EOG shares @ $69.25 and Buying-to-Close the 3 EOG 4/23/2021 Call options @ $.04 per share): +$482.73
= (+$1,489.98 options income +$123.75 dividend income - $1,131.00 capital appreciation)

Absolute Return-on-Investment: +2.4%
= +$482.73/$20,402.01
Equivalent Annualized Return-on-Investment: +37.5%
= (+$482.73/$20,402.01)*(365/23 days)

Tuesday, April 20, 2021

Covered Call Established in Alibaba Group Holdings Ltd.

With about one hour remaining in today's trading, a Covered Call position was established in Alibaba Group Holdings Ltd. (ticker symbol BABA) when the Covered Calls Advisor's buy/write limit order was executed.  One hundred shares were purchased at $229.44 and one April 30th, 2021 Call option was sold at $7.30 at the $225.00 strike price.  The time value when this Covered Call was established was $2.86 per share = [$7.30 Call options price - ($229.44 stock price - $225.00 strike price)], so the downside breakeven price is $222.14 ($225.00 strike price - $2.86 time value).  Given the Covered Calls Advisor's current cautious outlook, a moderately in-the-money Covered Call position was established with the Delta at 65.7, which approximates a probability of 65.7% that the Call option will be in-the-money on the options expiration date.

The Covered Calls Advisor prefers not to hold positions when there is an upcoming earnings report prior to any company's options expiration date, and there is no quarterly earnings report from Alibaba prior to its April 30th options expiration date.  But we have now entered the prime quarterly earnings reporting period for most companies during the next six weeks, so I will be following earnings reports for many companies to determine good companies and industries for current investments. I am finding it more difficult than normal to find good value opportunities at the present time, but Alibaba remains a core holding and with the stock down substantially today, this Alibaba Covered Call position was established.

As detailed below, a potential return-on-investment result for this Alibaba position is +1.3% absolute return (equivalent to +42.7% annualized return over the next 11 days) if the stock is in-the-money and therefore assigned on the April 30th, 2021 options expiration date.


Alibaba Group Holdings Ltd. (BABA) -- New Covered Call Position

The buy/write transaction was as follows:
04/20/2021 Bought 100 shares of Alibaba stock @ $229.44 per share 
04/20/2021 Sold 1 Alibaba April 30th, 2021 $225.00 Call option @ $7.30 per share
Note: The Implied Volatility of the Call option was 29.2 when this transaction was executed.  

A possible overall performance result (including commissions) would be as follows:
Covered Call Cost Basis: $22,214.67
= ($229.44 - $7.30) * 100 shares + $.67 commission

Net Profit Components:
(a) Option Income: +$730.00
= ($7.30 * 100 shares)
(b) Dividend Income: +$0.00 
(c) Capital Appreciation (If BABA stock is above $225.00 strike price at April 30th, 2021 expiration): -$444.00
= ($225.00 -$229.44) * 100 shares

Total Net Profit: +$286.00
= (+$730.00 Call option income +$0.00 dividend income -$444.00 capital appreciation)

Absolute Return-on-Investment: +1.3%
= +$286.00/$22,214.67
Equivalent Annualized Return-on-Investment: +42.7%
= (+$286.00/$22,214.67)*(365/11 days)

Monday, April 19, 2021

Established Covered Calls Position in Applied Materials Inc.

A Covered Calls position was established in Applied Materials Inc. (ticker AMAT) with an April 30th, 2021 options expiration date.   A buy/write transaction entered at a net debit of $123.18 was executed by purchasing 300 shares of AMAT at $129.45 and simultaneously selling three April 30th, 2021 Call options at the $125.00 strike price at $6.27 per share. The time value when this Covered Calls position was established was $1.82 per share = [$6.27 Call options price - ($129.45 stock price - $125.00 strike price)].  Given the Covered Calls Advisor's current cautious outlook, a moderately in-the-money Covered Calls position was established.  The Delta was 69.9 which approximates a probability of 69.9% that the Call options will be in-the-money and therefore the stock assigned (i.e. sold) on the options expiration date. The Implied Volatility of these Calls was 39.0 today when this transaction was executed.

As detailed below, the potential return-on-investment result is +1.5% absolute return in 12 days (equivalent to a +45.0% annualized return-on-investment).  

Applied Materials Inc. -- New Covered Calls Position Established
The buy/write transaction was:
04/19/2021 Bought 300 AMAT shares @ $129.45
04/19/2021 Sold 3 AMAT April 30th, 2021 $125.00 Call options @ $6.27
Note: the Open Interest in the Calls was 212 contracts.

A possible overall performance result (including commissions) for this Applied Materials Covered Calls position is as follows:
Covered Calls Position Cost Basis: $36,896.01
= ($129.45 stock price -$6.27 options price) *300 shares +$2.01 commissions

Net Profit:
(a) Options Income: +$1,881.00
= ($6.27 * 300 shares)
(b) Dividend Income: +$0.00
(c) Capital Appreciation (If AMAT assigned at $125.00 strike price at April 30th options expiration): -$1,335.00
= ($125.00-$129.45) * 300 shares


Total Net Profit (If AMAT assigned at $125.00 at options expiration): +$546.00
= (+$1,881.00 options income +$0.00 dividend income -$1,335.00 capital appreciation)

Absolute Return: +1.5%
= +$546.00/$36,896.01
Annualized Return: +45.0%
= (+$546.00/$36,896.01)*(365/12 days)

These returns will be achieved as long as the stock is above the $125.00 strike price at expiration.  If the stock declines below the strike price, the breakeven price of $123.18 ($129.45 -$6.27) provides 4.8% downside protection.

Closed Covered Calls Position in Oscar Health Inc.

At last Friday's options expiration, only one of the fourteen positions in the Covered Calls Advisor Portfolio expired with the stock price below its strike price.  This morning, that position (Oscar Health Inc.) was closed out by selling the 300 shares of Oscar Health stock.  The Covered Calls Advisor prefers to avoid quarterly earnings reports, and since we are now entering the bulk of earnings reporting season during the next six weeks and since Oscar's earnings will be reported before its next potential options expiration date on May 21st, the Oscar position was exited.  Fortunately, this position was closed out profitably as detailed below:

The return-on-investment results for this Oscar Health Inc. Covered Calls position were as follows:  +3.6% absolute return in 20 days (equivalent to a +65.7% annualized return-on-investment).  These results provide a good example of the advantage that can accrue from selling in-the-money Covered Calls.  Despite Oscar Health's stock decline from its purchase price of $25.49 to below its $25.00 strike price ($24.18 when sold today), an attractive return-on-investment result was still achieved from the time value decay in the Call options that were sold.


Oscar Health Inc. (OSCR) -- Covered Calls Position Closed

The simultaneous Buy/Write transaction was as follows:
03/30/2021 Bought 300 Oscar Health shares @ $25.49 per share 
03/30/2021 Sold 3 OSCR April 16th, 2021 $25.00 Call options @ $2.15 per share
Note: the Implied Volatility of the Call options was very high at 81.0 when this transaction occurred.
04/16/2021 3 OSCR 4/16/2021 $25.00 expired with the stock price below the strike price, so 300 shares remain in the Covered Calls Advisor Portfolio
04/19/2021 Sold 300 OSCR shares at $24.18 per share to close this Oscar Health Covered Calls position.

The overall performance results (including commissions) was as follows:
Covered Call Cost Basis: $7,004.01
= ($25.49 - $2.15) * 300 shares + $2.01 commission

Net Profit Components:
(a) Options Income: +$645.00
= ($2.15 * 300 shares)
(b) Dividend Income: +$0.00 
(c) Capital Appreciation (OSCR stock sold at $24.36 early this morning): -$393.00
= ($24.18 - $25.49) * 300 shares

Total Net Profit: +$252.00
= (+$645.00 options income +$0.00 dividend income -$393.00 capital appreciation)

Absolute Return: +3.6%
= +$252.00/$7,004.01
Equivalent Annualized Return: +65.7%
= (
+$252.00/$7,004.01)*(365/20 days)

Sunday, April 18, 2021

Recommended Reading -- #7

Here are four articles related to investing that I found most interesting, helpful, and/or thought-provoking during the past week that I want to share with you:

  1.  Five Superpowers -- It's always helpful to think about how we can improve ourselves that will also aid us in our investing decision-making.
  2.  Schwab's April Market Snapshot -- Good insights on where we are in the stock market right now.
  3.  The Growth-Value Cycle -- Will the outperformance of Growth stocks over Value stocks continue, or is it Value's time to shine?  And how should we think about constructing our portfolios with this in mind?
  4.  Revisiting Covered Calls and Protective Puts -- A recent (2021) academic study confirming the outperformance of Covered Calls versus a Buy-and-Hold strategy.  In addition, I especially like the way he helps us with strike price selection based on our personal risk tolerance -- see his discussion of loss aversion on page 5 and its implications as presented in Exhibit 5.            . 


Best Wishes and Godspeed,

Jeff Partlow
The Covered Calls Advisor
partlow@cox.net


Saturday, April 17, 2021

April 16th, 2021 Monthly Options Expiration Results

The Covered Calls Advisor Portfolio had fourteen positions since last month's (March 19th, 2021) monthly options expiration date.  During this past month, the Covered Calls Advisor Portfolio closed out thirteen of these fourteen positions profitably.

The return-on-investment results were as follows:   

  • Six Covered Calls positions expired in-the-money yesterday (on the April 19th, 2021 monthly options expiration date), so the Call options expired and the stocks were sold at their strike price.  The return-on-investment results were as follows:
  1. Alibaba Group Holdings Ltd. (BABA) -- +3.2% absolute return in 61 days (equivalent to +19.2% annualized return-on-investment).
  2. BorgWarner Inc. (BWA) -- +1.5% absolute return in 10 days (equivalent to +54.3% annualized return-on-investment).
  3. Comcast Corporation (CMCSA) -- +1.1% absolute return in 17 days (equivalent to +22.6% annualized return-on-investment).
  4. Qualcomm Inc. (QCOM) -- +4.0% absolute return in 26 days (equivalent to +55.9% annualized return-on-investment).
  5. Quest Diagnostics Inc. (DGX) -- +1.6% absolute return in 18 days (equivalent to +33.1% annualized return-on-investment); and
  6. RIO Tinto PLC (RIO) -- +1.7% absolute return in 25 days (equivalent to +24.9% annualized return-on-investment). 
  • Two 100% Cash-Secured Puts positions expired out-of-the-money (stock price above the strike price) yesterday (on the April 19th, 2021 monthly options expiration date), so the Put options expired and the cash received when these Puts were originally sold was retained as profit in the Covered Calls Advisor Portfolio.  The return-on-investment results were as follows:
  1. Herbalife Nutrition Ltd. (HLF) -- +1.5% absolute return in 18 days (equivalent to +31.2% annualized return-on-investment).
  2. Regeneron Pharmaceuticals Inc. (REGN) -- +0.7% absolute return in 12 days (equivalent to +20.1% annualized return-on-investment).
  • Two Covered Calls positions expired in-the-money on their weekly options expiration dates.     One Covered Call position in the S&P 500 ETF (SPY) expired in-the-money on its quarterly options expiration date).  The results of these three positions were:

  1. Financial Select Sector SPDR Fund (XLF) -- +1.1% absolute return in 17 days (equivalent to +23.0% annualized return-on-investment).
  2. iShares MSCI Emerging Markets ETF (EEM) -- +0.5% absolute return in 8 days (equivalent to +23.7% annualized return-on-investment).
  3. SPDR S&P 500 ETF (SPY) -- +0.7% absolute return in 17 days (equivalent to +15.3% annualized return-on-investment).


  • Two Covered Calls were closed on the day prior to the ex-dividend date by Early Assignment.  The stocks were assigned (i.e. sold) at their strike prices with the following results:
  1. Abbvie Inc. (ABBV) -- +0.8% absolute return in 8 days (equivalent to +34.5% annualized return-on-investment).
  2. Bristol-Myers Squibb Company (BMY) -- +1.2% absolute return in 12 days (equivalent to +36.4% annualized return-on-investment).


One of the fourteen positions this month (Covered Calls in Oscar Health Inc.) expired out-of-the-money (stock price was $24.44 and strike price was $25.00) on the April 19th expiration date, so the 300 shares now remain in the Covered Calls Advisor Portfolio. A decision will be made early next week to either sell these shares or to continue with the Covered Calls position by selling three future Call options against the shares currently held.

During the past year (last 12 months) 125 of 127 positions have been closed out profitably.  Only one position was closed out at a loss and one position in Oscar Health currently remains open in the Covered Calls Advisor Portfolio.  Warning: these results have been exceptional and are certainly not to be considered as the norm for Covered Calls investing.  A more reasonable expectation for a well-informed and disciplined Covered Calls investment portfolio is to be profitable on two-thirds (67%) or more of positions.  

As shown in the right sidebar, there are currently two open positions in the Covered Calls Advisor Portfolio.  All future transactions and return-on-investment results for these positions will be posted on this blog site on the same day the transactions occur.  As always, I welcome receiving your emails whenever you have any comments or questions related to this post or anything related to Covered Calls investing.

Best Wishes,
Jeff
partlow@cox.net


Thursday, April 15, 2021

Covered Calls in IRA Accounts

I am not a CPA, Enrolled Agent, or Tax Attorney -- so I don't give tax advice. Nevertheless, as an informed investor and self-proclaimed Covered Calls Advisor, I want to be sure you are aware of the benefits of Covered Calls investing in IRA accounts.  This article from Investopedia.com (see here) briefly summarizes these advantages as follows:

IRA Advantages -- The possibility of triggering a possible reportable capital gain makes covered call writing an ideal strategy for either a traditional or Roth IRA.  This allows the investor to buy back the stock at an appropriate price without having to worry about tax consequences, as well as generate additional income that can either be taken as distributions or reinvested.

For more detailed information on the tax implications of Covered Calls, I have found this article from Fidelity to be the most informative -- please read it here.

My wife and I are retired and have several IRA accounts (Traditional, Roth, and Rollover IRAs) as well as a brokerage account.  We prioritize by investing only via Covered Calls in our IRAs and we re-invest our capital gains there into additional Covered Calls positions.  We are fortunate that we will only need to begin taking annual taxable withdrawals from our Traditional and Rollover IRAs starting at age 72 when the current tax laws related to Required Minimum Distributions (RMDs) kicks in.  (Note: if we take any future withdrawals from our Roth IRAs that will be non-taxable income).  Finally, regarding our brokerage account, we also do some Covered Calls investing there and pay taxes on our realized capital gains each year.  The bookkeeping is simplified substantially since we have our broker (Schwab) download all our brokerage account transaction details into TurboTax.  

Best Wishes and Godspeed,
Jeff
partlow@cox.net

Wednesday, April 14, 2021

Early Assignment of Abbvie Inc. Covered Calls

Early this morning, the Covered Calls Advisor was notified by Schwab that the two Abbvie Inc. April 23rd, 2021 $104.00 Call options were exercised early yesterday (on April 13th, 2021), the last business day prior to today's (April 14th) ex-dividend date.   The Abbvie stock price has increased slightly from its purchase price of $107.51 to $108.20 at the market close yesterday.  So the initial $.78 time value [$4.29 Call options price - ($107.51 stock price - $104.00 strike price)] declined to only $.03 time value remaining at market close yesterday, so the owner of the Calls exercised their right to buy the 200 shares of Abbvie at the $104.00 strike price and capture today's $1.30 ex-dividend.  

As detailed below, a +0.8% absolute return in 8 days (equivalent to a +34.5% annualized return-on-investment) was achieved for this position. 

Abbvie Inc. (ABBV) -- Early Assignment of Abbvie Covered Calls Position

The simultaneous buy/write transaction was as follows:
04/06/2021 Bought 200 shares of Abbvie Inc. stock @ $107.51 per share 
04/06/2021 Sold 2 ABBV April 23rd, 2021 $104.00 Call options @ $4.29 per share
04/13/2021 Early assignment of 2 ABBV Call options so these options expired and the 200 shares were sold at the $104.00 strike price.

The overall performance results (including commissions) was as follows:
Covered Call Cost Basis: $20,645.34
= ($107.51 - $4.29) * 200 shares + $1.34 commission

Net Profit Components:
(a) Options Income: +$858.00
= ($4.29 * 200 shares)
(b) Dividend Income (Abbvie shares assigned early on 4/13/2021, the business day prior to the 4/14/2021 ex-dividend date): = +$0.00
(c) Capital Appreciation (ABBV shares assigned early on 4/13/2021): -$702.00
= ($104.00 strike price - $107.51 stock purchase price) * 200 shares

 
Net Profit: +$156.00
= (+$858.00 options income +$0.00 dividend income - $702.00 capital appreciation)

 Absolute Return-on-Investment: +0.8%
= +$156.00/$20,645.34
Equivalent Annualized Return-on-Investment: +34.5%
= (+$156.00/$20,645.34)*(365/8 days)

Wednesday, April 7, 2021

Established Covered Calls in BorgWarner Inc.

Early this afternoon, a new Covered Calls position was established in BorgWarner Inc. (ticker BWA) with an April 16th, 2021 options expiration date.   A buy/write transaction entered at a net debit of $44.34 was executed by purchasing 300 shares of BorgWarner Inc. at $45.63 and simultaneously selling three April 16th, 2021 Call options at the $45.00 strike price at $1.29 per share. The corresponding time value when this Covered Calls position was established was $.66 per share = [$1.29 Call options price - ($45.63 stock price - $45.00 strike price)].  Given the Covered Calls Advisor's current cautious outlook, an in-the-money Covered Calls position was established.  The Delta was 62.2 which approximates a probability of 62.2% that the Call options will be in-the-money and therefore the stock assigned (i.e. sold) on the options expiration date. The Implied Volatility of these Calls was 28.2 today when this transaction was executed.

As detailed below, the potential return-on-investment result is +1.5% absolute return in 10 days (equivalent to a +54.3% annualized return-on-investment) if the stock is in-the-money at closing on the options expiration date.  The approximate Expected Value annualized return-on-investment was +33.8% (+54.3% x 62.2%) at the time this position was established.  

BorgWarner Inc. (BWA) -- New Covered Calls Position

The Buy/Write transaction was as follows:
04/07/2021 Bought 300 shares of BorgWarner Inc. stock @ $45.63 per share 
04/07/2021 Sold 3 BWA April 16th, 2021 $45.00 Call options @ $1.29 per share

A possible overall performance result (including commissions) if the stock price is above the $45.00 strike price at expiration would be as follows:
Covered Call Cost Basis: $13,304.01
= ($45.63 - $1.29) * 300 shares + $2.01 commission

Net Profit Components:
(a) Options Income: +$387.00
= ($1.29 * 300 shares)
(b) Dividend Income: +$0.00 
(c) Capital Appreciation (If BorgWarner stock is above $45.00 strike price at the April 16th, 2021 options expiration): -$189.00
= ($45.00 - $45.63) * 300 shares

Total Net Profit: +$198.00
= (+$387.00 options income +$0.00 dividend income -$189.00 capital appreciation)

Absolute Return: +1.5%
= +$198.00/$13,304.01
Equivalent Annualized Return: +54.3%
= (+$198.00/$13,304.01)*(365/10 days)

The downside 'breakeven price' at expiration is at $44.34 ($45.63 - $1.29), which is 2.8% below the current market price of $45.63.

Tuesday, April 6, 2021

Established Covered Calls in Abbvie Inc. Using Dividend Capture Strategy

Today, a Covered Calls position was established in Abbvie Inc. (ticker ABBV) with the purchase of 200 shares at $107.51 per share and two April 23rd, 2021 Call options were sold for $4.29 per share at the $104.00 strike price.  This transaction occurred as a buy/write limit order at a net debit of $103.22 per share.  The corresponding time value (aka extrinsic value) in the Call options was $.78 per share = [$4.29 Call options premium received - ($107.51 stock purchase price - $104.00 options strike price)].  A moderately in-the-money Covered Calls positions was established with the Delta of the Calls at 67.7 when this buy/write transaction was executed, which approximates the probability of assignment on the April 23rd, 2021 options expiration date. 

Abbvie goes ex-dividend at $1.30 per share (4.8% annualized dividend yield at the current stock price) on April 14th which is prior to the April 23rd options expiration date, so this dividend is included in the potential return-on-investment results shown below.  Also shown below, eight of the nine criteria in the Covered Calls Advisor's Dividend Capture Strategy spreadsheet were met for this position and the next quarterly earnings report on April 30th, 2021 is after the April 23rd options expiration date. 

Abbvie is a research-based pharmaceutical company with a strong pipeline in immunology, oncology, neuroscience plus targeted efforts in cystic fibrosis and women's health.  They acquired Allergan (think Botox) almost a year ago which aids Abbvie's growth prospects.  Abbvie is currently a very good value based on its current and forward year P/E ratios.  But its #1 drug (Humira) faces biosimilar competition beginning in 2023, so its aggressive pipeline and acquisition strategy is designed to mitigate the upcoming revenue decline from that event.  But the Covered Calls Advisor does not view Abbvie as a long-term core holding.  Instead, because of its generous dividend, it will continue to re-evaluated each quarter as a Dividend Capture Strategy candidate, just like this current Abbvie Covered Calls position. 

Two potential return-on-investment results are: (a) +0.8% absolute return (equivalent to +34.5% annualized return for the next 8 days) if the stock is assigned early on the day prior to the April 14th ex-dividend date; or (b) +2.0% absolute return (equivalent to +40.9% annualized return for the next 18 days) if the stock is assigned at market close on the April 23rd, 2021 options expiration date.  

The approximate expected value annualized return on investment is +27.7% (+40.9% aroi x 67.7% probability of assignment).   


Abbvie Inc. (ABBV) -- New Covered Calls Position

The simultaneous buy/write transaction was as follows:
04/06/2021 Bought 200 shares of Abbvie Inc. stock @ $107.51 per share 
04/06/2021 Sold 2 ABBV April 23rd, 2021 $104.00 Call options @ $4.29 per share
04/14/2021 Upcoming ex-dividend of $1.30 per share

Two possible overall performance results (including commissions) would be as follows:
Covered Call Cost Basis: $20,645.34
= ($107.51 - $4.29) * 200 shares + $1.34 commission

Net Profit Components:
(a) Options Income: +$858.00
= ($4.29 * 200 shares)
(b) Dividend Income (If Abbvie shares assigned on 4/13/2021, the business day prior to the 4/14/2021 ex-dividend date): = +$0.00; or
(b) Dividend Income (If Abbvie shares assigned at the April 23rd, 2021 options expiration): +$260.00
= $1.30 per share x 200 shares
(c) Capital Appreciation (If ABBV shares assigned early on 4/13/2021): -$702.00
= ($104.00 strike price - $107.51 stock purchase price) * 300 shares; or
(c) Capital Appreciation (If ABBV shares assigned with stock above $104.00 strike price on the April 23rd options expiration): -$702.00
= ($104.00 strike price - $107.51 stock purchase price) * 200 shares

1. Potential Net Profit (If Abbvie shares assigned early on 4/13/2021, the day prior to the ex-dividend date): +$156.00
= (+$858.00 options income +$0.00 dividend income - $702.00 capital appreciation)
2. Potential Net Profit (If ABBV price is above $104.00 strike price at April 23rd options expiration): +$416.00
= (+$858.00 options income +$260.00 dividend income - $702.00 capital appreciation)

1. Absolute Return (If EOG shares assigned early on the day prior to the April 14th ex-dividend date): +0.8%
= +$156.00/$20,645.34
Equivalent Annualized Return (If assigned early on day prior to ex-div date): +34.5%
= (+$156.00/$20,645.34)*(365/8 days)
2. Absolute Return (If Abbvie price is above $104.00 strike price at April 23rd options expiration): +2.0%
= +$416.00/$20,645.34
Equivalent Annualized Return (If assigned on 3/26/2021 options expiration date): +40.9%
= (+$416.00/$20,645.34)*(365/18 days)

At least eight of the nine metrics used in the Covered Calls Advisor's Dividend Capture Strategy spreadsheet (see below) must be 'YES' prior to establishing a new Covered Calls position using the Covered Calls Advisor's Dividend Capture strategy.  As shown below, eight criteria are achieved for this Abbvie Inc. Covered Call position.


Monday, April 5, 2021

Spreadsheet for Evaluating Possible Dividend Capture Covered Calls

Below is an Excel spreadsheet format developed specifically to estimate potential annualized return-on-investments for Covered Calls with companies having good investment potential and with ex-dividend dates prior to the options expiration dates.  I thought I would share this since some of you might want to use a similar spreadsheet format.  

I did this spreadsheet this morning during pre-market hours (i.e. before the market opened).  For each company, I look at some different expiration dates and strike prices before selecting my preferred combination and entering it on the spreadsheet.  In my case, I'm looking for positions that would most likely meet the criteria I've developed for my Dividend Capture Strategy.  

After market open this morning, I made a decision to enter buy/write limit orders for LNC and NTAP, but neither one executed today.  That's okay with me since I almost always enter Covered Calls limit orders at the net debit price that I would like to pay.  Sometimes they execute and sometimes they don't -- and that's fine with me.  


Established Cash-Secured Puts Position in Uber Technologies Inc.

This afternoon, a small 100% Cash-Secured Put options position was established in Uber Technologies Inc. (ticker UBER) at the May 21st, 2021 options expiration date and the $42.50 strike price by selling two Puts at $.53 per share when the stock price was $45.80 (7.8% above the strike price).  This position had a probability of assignment of 79.3% when this position was established.

Uber announced quarterly earnings yesterday that exceeded expectations. A $600 million charge was taken because of a U.K. reclassification of Uber's labor costs which highlighted the regulatory labor concerns associated with gig economy companies like Uber and the stock tanked by more than 10% today when this position was established.  The Covered Calls Advisor believes this is an overreaction and agrees with JPMorgan, Morgan Stanley, and Morningstar who all came out today reiterating their Overweight/Buy ratings and $67 to $74 price targets.  Uber has developed a strong brand in both its mobility and delivery segments and the strengthening economy bodes well for its growth potential this year and beyond.  Also, concerns in the investment community about Uber's current difficulty in finding drivers will likely be successfully addressed as economic activity continues to rebound from the pandemic shutdowns.        

As detailed below for this Uber 100% Cash-Secured Puts position, there is potential for a +1.2% absolute return in 16 days (equivalent to a +28.4% annualized return-on-investment). 


Uber Technologies Inc. (UBER) -- New 100% Cash-Secured Puts Position
The transaction today was as follows:
05/06/2021  Sold 2 Uber Technologies Inc. May 21st, 2021 $42.50 100% Cash-Secured Put options @ $.53 per share.

The Covered Calls Advisor does not use margin, so the detailed information on this position and the potential result detailed below reflect that this position was established using 100% cash securitization for the two Put options sold.

A possible overall performance result (including commissions) would be as follows:
100% Cash-Secured Put Cost Basis: $8,395.34
= ($42.50 - $.53) * 200 shares + $1.34 commission

Net Profit:
(a) Options Income: +$104.66
= ($.53 * 200 shares) - $1.34 commission
(b) Dividend Income: +$0.00
(c) Capital Appreciation (If UBER stock is above $42.50 strike price at the May 21st expiration): +$0.00
= ($42.50 - $42.50) * 200 shares

Total Net Profit (If Uber stock price is out-of-the-money (above $42.50 strike price) at options expiration): +$104.66
= (+$104.66 options income +$0.00 dividend income +$0.00 capital appreciation)

Absolute Return (If Regeneron is above $440.00 strike price at the March 19th, 2021 options expiration) : +1.2%
= +$104.66/$8,395.34
Annualized Return: +28.4%
= (+$104.66/$8,395.34)*(365/16 days)

The downside 'breakeven price' at expiration is at $41.97 ($42.50 - $.53), which is 8.4% below the current market price of $45.80.

Continuation of Alibaba Group Holdings Ltd. Covered Calls

At the April 1st, 2021 options expiration date, the Covered Calls position in Alibaba Group Holdings Ltd. (ticker symbol BABA) expired with the stock price at $224.36, well below the $242.50 strike price.  So, the two Call options expired and the 200 shares of Alibaba stock were retained in the Covered Calls Advisor Portfolio.  Today, with the Alibaba Group Holdings Ltd. stock price at $225.27, a sell-to-open order was executed to sell 2 April 16th, 2021 Call options at the $235.00 strike price for $3.00 per share to continue this Covered Calls position.

Alibaba has been a losing position since first established two months ago.  It has suffered primarily from government regulation pressure from both monopolistic concerns by China and from U.S. efforts to require that Alibaba conform to U.S. accounting standards or face possible de-listing from American Exchanges.  Nevertheless, I believe Alibaba is undervalued at only 19 times next year's earnings given its continuing strong growth potential. Comparing that to forward year P/E multiples for Amazon and WalMart of 66 and 25 respectively, Alibaba has a lot of upside potential if it can weather the current regulatory headwinds. 

As detailed below, two potential return-on-investment results for this Alibaba Group Holdings Ltd. position are: (1) -0.9% absolute return in 61 days (equivalent to a -5.1% annualized return-on-investment) if the stock price is unchanged at $225.27 at the April 16th, 2021 options expiration; or (2) +3.2% absolute return in 61 days (equivalent to a +19.2% annualized return-on-investment) if the stock closes above the $235.00 strike price.

Alibaba Group Holdings Ltd. -- Continuation of Covered Calls Position
The transactions history is as follows:
2/08/2021 Sold 1 Alibaba 2/26/2021 $250.00 100% Cash-Secured Put option @ $3.10 per share
2/23/2021 Bought 100 shares of Alibaba stock @ $244.92 per share 
2/23/2021 Sold 1 Alibaba March 5th, 2021 $235.00 Call option @ $12.84 per share 

Note: this was a simultaneous Buy/Write transaction.  The Implied Volatility of the Call options was 39.0 when this transaction was executed.
2/26/2021 1 BABA $250.00 Cash-Secured Put option expired out-of-the-money, so 100 shares were purchased at the $250.00 strike price
3/05/2021 1 BABA $235.00 Call option expired out-of-the-money and 100 shares were retained in the Covered Calls Advisor Portfolio
3/09/2021 Sold 2 BABA 3/19/2021 $245.00 Call options @ $4.25 per share against the 200 BABA shares owned.
3/19/2021 2 BABA $245.00 Call options expired out-of-the-money and 200 shares were retained in the Covered Calls Advisor Portfolio
03/23/2021 Sold 2 BABA 4/1/2021 $242.50 Call options @ $3.35 per share against the 200 BABA shares owned.
04/01/2021 2 BABA $242.50 Call options expired out-of-the-money and 200 shares were retained in the Covered Calls Advisor Portfolio.
4/05/2021 Sold 2 BABA 4/16/2021 $235.00 Call options @ $3.00 per share against the 200 BABA shares owned.

Two possible overall performance results (including commissions) would be as follows:
Covered Calls Cost Basis: $47,589.34
= ($245.91 - $7.97) * 200 shares + $1.34 commissions

Net Profit Components:
(a) Options Income: +$3,710.65
= ($3.10 + $12.84) * 100 shares +( $4.25 + $3.35 + $3.00) * 200 shares - $3.35 commissions
(b) Dividend Income: +$0.00 
(c) Capital Appreciation (If Alibaba shares are unchanged at $225.27 at the April 16th options expiration): -$4,128.00
= ($225.27 - $245.91) * 200 shares; OR
(c) Capital Appreciation (If Alibaba is above $235.00 strike price at the April 16th expiration): -$2,182.00.00
= ($235.00 - $245.91) * 200 shares

1. Total Net Profit (If BABA shares unchanged at $225.27 at options expiration): -$417.35
= (+$3,710.65 options income +$0.00 dividend income -$4,128.00 capital appreciation)
2. Total Net Profit (If BABA shares close above $235.00 at the April 16th options expiration): +$1,528.65
= (+$3,710.65 options income +$0.00 dividend income -$2,182.00 capital appreciation)

1. Absolute Return (If Alibaba shares price unchanged at $225.27): -0.9%
= -$417.35/$47,589.34
Equivalent Annualized Return: -5.1%
= (
-$417.35/$47,589.34)*(365/61 days)
2. Absolute Return (If stock closes above $235.00 strike price at options expiration): +3.2%
= +$1,528.65/$47,589.34
Equivalent Annualized Return: +19.2%
= (
-$417.35/$47,589.34)*(365/61 days)

Sunday, April 4, 2021

Recommended Reading -- #6

Here are five articles related to investing that I found most interesting, helpful, and/or thought-provoking during the past week that I want to share with you:

  1. The Beauty of Stock Markets  
  2. The 2 Most Powerful Forces In Markets 
  3. Potential Market Top Approaching? 
  4. Quality at a Discount Investing: Six Elements of Quality  
  5. 4 Vital Characteristics To Look For In Dividend Stocks 

Finally, here's a link to several informative articles written by Bob Seawright during the past decade in his excellent "Above the Market" blog: link
Since there are so many articles here, I suggest you bookmark this link to read as your time allows over the next few of weeks. 

Best Wishes and Godspeed,

Jeff Partlow
The Covered Calls Advisor
partlow@cox.net


Saturday, April 3, 2021

Overall Market Meter is Slightly Bearish

Today, the Covered Calls Advisor evaluated the current values for each of the seven factors used to determine the "Overall Market Meter" rating.  The seven factors used are categorized as macroeconomic, momentum, value, and growth metrics as as follows:
- macroeconomic (the first two indicators in the chart below),
- momentum (next two indicators in the chart),
- value (next two indicators), and
- growth (the last indicator).


The current Market Meter average of 2.43 (see blue line at the bottom of the chart above) is in the Slightly Bearish range (Note: the Slightly Bearish range is from 1.51 to 2.50). 

So what is our current Covered Calls investing strategy?  Based on the Covered Calls Advisor's "Slightly Bearish" Overall Market Meter (see right sidebar), the corresponding strategy is to "on-average sell between 2% and 5% in-the-money Covered Calls for options expiration dates during the next month".   

I agree with Ben Graham and with the content of this article: link -- that it is impossible to successfully time the market on a consistent basis.  But I cannot seem to totally ignore my need to have an opinion on its most likely upcoming direction.  As Covered Calls investors, we need to select a strike price for every position we establish.  Some Covered Calls investors avoid this important strike price selection decision entirely by always picking the same strike price every time (for example, the closest to at-the-money strike price, or one strike out-of-the-money).  But I've never been able to do that.  I prefer a more active decision-making approach; so I select strike prices based on my Overall Market Meter sentiment indicator -- at-the-money strike prices if the Overall Market Meter is Neutral, out-of-the-money if Bullish, and in-the-money if Bearish.  Sometimes my Market Meter is right and sometimes its wrong, but over the years it has helped me in three primary ways: (1) it has helped me read more and thus learn more about the myriad factors that influence the overall stock market and the individual companies that comprise it; (2) it has given me a slight return-on-investment edge compared with always using the same strike price [and we all need to seek and find our investing edges: (See link)]; and (3) it has contributed to my commitment to maintaining a disciplined investing process -- and with a "disciplined investing process", we are following Warren Buffett's advice to "take the emotion out of investing and simply stick with good businesses" (read this prior article from my blog: (link).       

Regards and Godspeed to All,
Jeff
partlow@cox.net

Friday, April 2, 2021

April 1st, 2021 Options Expiration Results

The Covered Calls Advisor Portfolio had three positions with April 1st, 2021 options expirations.  Two positions (Financial Select Sector SPDR Fund and iShares MSCI Emerging Markets ETF) closed in-the-money, so the maximum potential return-on-investment results were achieved for these positions.   The results for these closed positions were:

  • Financial Select Sector SPDR Fund (XLF) -- +1.1% absolute return (equivalent to +23.0% annualized roi) for the 17 days of this investment
  • iShares MSCI Emerging Markets ETF (EEM) -- +0.5% absolute return (equivalent to +23.7% annualized roi) for the 8 days of this investment

The Covered Calls position in Alibaba Group Holdings Ltd. at the $242.50 strike price closed out-of-the money at $224.36, so the Call options expired and 200 shares of Alibaba stock now remain in the Covered Calls Advisor Portfolio.  This position is now at a net loss and it is likely that the position will be continued early next week by selling two Calls against the 200 shares currently held.   

The cash now available from the assignment (i.e. closing) of the two in-the-money positions will be retained until new Covered Calls and/or 100% Cash-Secured Puts positions are established.  Given the Covered Calls Advisor's currently cautious Overall Market outlook, new positions will be hedged by continuing to establish Covered Calls at moderately in-the-money strike prices with good downside protection. 

The detailed transactions and results for these two closed positions are as follows:


1. Financial Select Sector SPDR Fund(XLF) --
Covered Calls Position Closed Out

The buy/write transaction was as follows:
03/16/2021 Bought 400 shares of the Financial Select Sector SPDR Fund @ $34.16 per share 
03/16/2021 Sold 4 XLF April 1st, 2021 $33.00 Call options @ $1.36 per share when the Implied Volatility of the Call options was 21.6
03/22/2021 Ex-distribution of $.1512 per share
04/01/2021 4 XLF Call options expired in-the-money and 400 XLF shares were sold at the $33.00 strike price.  The XLF shares closed at $34.47 on the 4/1/2021 expiration date.


The overall performance results (including commissions) was as follows:
Covered Calls Cost Basis: $13,122.68
= ($34.16 - $1.36) * 400 shares + $2.68 commission

Net Profit Components:
(a) Options Income: +$544.00
= ($1.36 * 400 shares)
(b) Distribution Income (XLF shares assigned on April 1st options expiration date): +$60.48
=  $.1512 per share x 400 shares
(c) Capital Appreciation: -$464.00
= ($33.00 - $34.16) * 400 shares

Total Net Profit (XLF shares assigned on April 1st options expiration date): +$140.48
= (+$544.00 Call options income +$60.48 dividend income -$464.00 capital appreciation)

Absolute Return: +1.1%
= +$140.48/$13,122.68
Equivalent Annualized Return: +23.0%
= (+$140.48/$13,122.68)*(365/17 days)


2. iShares MSCI Emerging Markets ETF (EEM) -- 100% Cash-Secured Puts Position Closed Out
The transaction today was as follows:
03/24/2021  Sold 10 EEM April 1st, 2021 $51.00 100% Cash-Secured Put options @ $.27 per share.
04/01/2021  The price of EEM shares was $53.86 at expiration on 4/1/2021 so the 10 EEM $51.00 Cash-Secured Puts expired in-the-money and the Put options premium was retained as profit in the Covered Calls Advisor Portfolio.

The overall performance result (including commissions) was as follows:
100% Cash-Secured Put Cost Basis: $50,736.70
= ($51.00 - $.27) * 1,000 shares + $6.70 commission

Net Profit:
(a) Options Income: +$263.30
= ($.27 * 1,000 shares) - $6.70 commission
(b) Dividend Income: +$0.00
(c) Capital Appreciation (EEM shares closed above $51.00 strike price at the April 1st expiration): +$0.00
= ($51.00 - $51.00) * 1,000 shares

Total Net Profit: +$263.30
= (+$263.30 Put options income +$0.00 dividend income +$0.00 capital appreciation)

Absolute Return: +0.5%
= +$263.30/$50,736.70
Annualized Return: +23.7%
= (+$263.30/$50,736.70)*(365/8 days)

Please email me with any questions or comments related specifically to this post or whenever you have comments or questions related to Covered Calls investing.

Best Wishes and Godspeed,
Jeff Partlow
partlow@cox.net

Thursday, April 1, 2021

Established Covered Calls in EOG Resources Inc. Using Dividend Capture Strategy

Today, a Covered Call position was established in EOG Resources Inc. (ticker EOG) with the purchase of 300 shares at $73.02 per share and three April 23rd, 2021 Call options were sold for $5.02 per share at the $69.50 strike price.  A moderately in-the-money Covered Calls positions was established with the Delta of the Calls at 66.4 when this buy/write transaction was executed, which approximates the probability of assignment on the April 23rd, 2021 options expiration date.  The time value in the Call options was $1.50 per share = [$5.02 Call options premium received - ($73.02 stock purchase price - $69.50 options strike price)]. 

EOG goes ex-dividend at $.4125 per share (2.3% annualized dividend yield at the current stock price) on April 15th which is prior to the April 23rd options expiration date, so this dividend is included in the potential return-on-investment results shown below.  All nine criteria in the Covered Calls Advisor's Dividend Capture Strategy spreadsheet were met for this position and the next quarterly earnings report on May 6th, 2021 is after the April 23rd options expiration date. 

Two potential return-on-investment results are: (a) +2.2% absolute return (equivalent to +57.5% annualized return for the next 14 days) if the stock is assigned early on the day prior to the April 15th ex-dividend date; or (b) +2.8% absolute return (equivalent to +44.6% annualized return for the next 23 days) if the stock is assigned at market close on the April 23rd, 2021 options expiration date.  

The approximate expected value annualized return on investment is +29.6% (+44.6% aroi x 66.4% probability of assignment).   


EOG Resources Inc.(EOG) -- New Covered Calls Position

The simultaneous buy/write transaction was as follows:
04/01/2021 Bought 300 shares of EOG Resources Inc. stock @ $73.02 per share 
04/01/2021 Sold 3 EOG April 23rd, 2021 $69.50 Call options @ $5.02 per share
Note: The options Implied Volatility was 33.2 when this buy/write transaction executed.
04/15/2021 Upcoming ex-dividend of $.4125 per share

Two possible overall performance results (including commissions) would be as follows:
Covered Call Cost Basis: $20,402.01
= ($73.02 - $5.02) * 300 shares + $2.01 commission

Net Profit Components:
(a) Options Income: +$1,506.00
= ($5.02 * 300 shares)
(b) Dividend Income (If EOG Resources shares assigned on 4/14/2021, the business day prior to the 4/15/2021 ex-dividend date): = +$0.00; or
(b) Dividend Income (If EOG shares assigned at the April 23rd, 2021 options expiration): +$123.75
= $.4125 per share x 300 shares
(c) Capital Appreciation (If EOG shares assigned early on 4/14/2021): -$1,056.00
= ($69.50 strike price - $73.02 stock purchase price) * 300 shares; or
(c) Capital Appreciation (If EOG shares assigned with stock above $69.50 strike price on the April 23rd options expiration): -$1,056.00
= ($69.50 strike price - $73.02 stock purchase price) * 300 shares

1. Potential Net Profit (If EOG shares assigned early on 4/14/2021, the day prior to the ex-dividend date): +$450.00
= (+$1,506.00 options income +$0.00 dividend income - $1,056.00 capital appreciation)
2. Potential Net Profit (If EOG price is above $69.50 strike price at April 15th options expiration): +$573.75
= (+$1,506.00 options income +$123.75 dividend income - $1,056.00 capital appreciation)

1. Absolute Return (If EOG shares assigned early on the day prior to the April 15th ex-dividend date): +2.2%
= +$450.00/$20,402.01
Equivalent Annualized Return (If assigned early on day prior to ex-div date): +57.5%
= (+$450.00/$20,402.01)*(365/14 days)
2. Absolute Return (If EOG price is above $69.50 strike price at April 23rd options expiration): +2.8%
= +$573.75/$20,402.01
Equivalent Annualized Return (If assigned on 3/26/2021 options expiration date): +44.6%
= (+$573.75/$20,402.01)*(365/23 days)

At least eight of the nine metrics used in the Covered Calls Advisor's Dividend Capture Strategy spreadsheet (see below) must be 'YES' prior to establishing a new Covered Calls position using the Covered Calls Advisor's Dividend Capture strategy.  As shown below, eight criteria are achieved for this EOG Resources Covered Call position.


March 31st, 2021 Options Expiration -- SPDR S&P 500 ETF Covered Call Position Assigned

Yesterday, the March 31st, 2021 (a quarterly options expiration date) Covered Call position in the SPDR S&P 500 ETF (ticker SPY) expired in-the-money, so the 100 shares of SPY were assigned (i.e. sold) at the $380.00 strike price.  As detailed below, the return-on-investment (ROI) result was  +0.7% absolute return (equivalent to +15.3% annualized return-on-investment for the 17 days holding period).   

It is always desirable to achieve a positive return-on-investment, but the +15.3% aroi in this case is below the Covered Calls Advisor's minimum target of greater than +20.0%.  Since ETFs (such as SPY) hold so many stocks, their risk (and therefore also their Implied Volatility) is lower than the Implied Volatility of the individual stocks contained in them.  So because the Implied Volatility for individual stocks is higher, the potential return-on-investment when establishing Covered Calls with individual stocks is also higher.  This is the primary reason the Covered Calls Advisor prefers buying stocks (not ETFs) for Covered Calls positions.    


    SPDR S&P 500 ETF (SPY) --
    Covered Call Position Closed by Assignment at Expiration
    The buy/write transaction was as follows:
    03/15/2021 Bought 100 shares of SPDR S&P 500 ETF @ $392.22 per share 
    03/15/2021 Sold 1 SPY March 31st, 2021 $380.00 Call option @ $13.64 per share
    Note: the Implied Volatility of the Call options was 17.2
    03/19/2021 Ex-distribution of $1.2778 per share
    03/31/2021 SPY Call option expired in-the-money so the 100 SPY shares were assigned (i.e. sold) at the $380.00 strike price.

    Two possible overall performance results (including commissions) would be as follows:
    Covered Calls Cost Basis: $37,858.67
    = ($392.22 - $13.64) * 100 shares + $.67 commission

    Net Profit Components:
    (a) Options Income: +$1,364.00
    = ($13.64 * 100 shares)
    (b) Distribution Income (SPY shares assigned on March 31st options expiration date): +$127.78
    =  $1.2778 per share x 100 shares
    (c) Capital Appreciation: -$1,222.00
    = ($380.00 - $392.22) * 100 shares

    Total Net Profit (SPY shares assigned on March 31st options expiration date): +$269.78
    = (+$1,364.00 options income +$127.78 dividend income -$1,222.00 capital appreciation)

    Absolute Return: +0.7%
    = +$269.78/$37,858.67
    Equivalent Annualized Return: +15.3%
    = (+$269.78/$37,858.67)*(365/17 days)